Mapping HB2

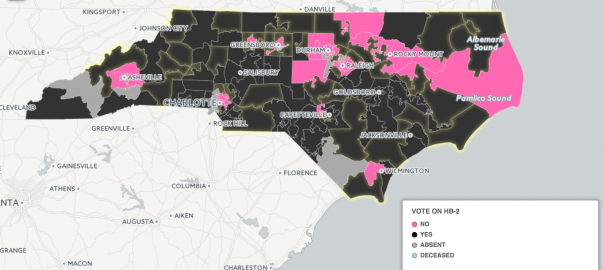
After the house votes came down on HB2, I was curious to see the geography of the vote (which largely parallels the county-by-county vote on Amendment 1 from a few years ago), but also wanted to understand what it would take to elect a different set of representatives to the NC State House. Because of partisan re-districting, a large number of the NC House districts are non-competitive, and in fact at the filing deadline in December 2015, 29 House Republicans (and 28 Democrats) were running unopposed!

In addition to showing the HB2 vote breakdown, this map highlights in pale yellow outlines the districts where: (1) the representative voted for HB2, (2) the House member is running in 2016, and (3) their race in 2014 was reasonably competitive — meaning they got less than 70% of the 2014 vote. These are some of the districts where concerted electoral organizing has a shot at changing the make-up of the legislature next year.

#WeCame2SlayHB2

Community Mapping

Maps don’t always answer straight-forward questions. They can also be powerful tools to build community and help navigate through situations where it’s not clear what questions to ask. Community mapping is a longer-term dialogue between maps & data and the lived experiences and political realities of people. It’s an iterative, back-and-forth process which can be rewarding and fruitful community organizations and for me as a cartographer. For more on community mapping and counter-cartography, see my thesis: Alternative Cartographies Building Collective Power.

In the past, I have:

  • Developed maps & visualizations of the legacy of agricultural infrastructure in Warren County, NC, based on interviews I helped conduct as part of a process of community economic development led by Working Landscapes
  • Worked with residents in the oldest historically African-American neighborhood in Chapel Hill to understand and document the impact that student-housing development was having on the quality of life in their neighborhood; the maps we produced helped lead the Town Council to pass a one-year moratorium on development.
  • Designed mapping and data components for None of the Above, a traveling exhibit about the school-to-prison pipeline, based on interviews with teachers, students, people in prison and folks working in the legal system (see more of my work on Behance and also here)
  • Worked with students at Queen Mary University to produce a counter/map of their campus and it’s role in the policing of immigration in the United Kingdom, as part of a monthlong residency at that campus.

GIS

GIS software, combined with my knowledge of demographic data sources, makes it easy to get answers to questions like:

  • Which legislative districts overlap with a given city?
  • How many people live within a 5-minute walk of each store?
  • To what extent are there racial disparities in the location of landfills or point-source pollution?
  • What is the geographic distribution of households living in poverty?

GIS projects can range from tutoring sessions over Skype where I walk you through how to use ArcGIS or open-source QGIS to accomplish a particular task (1-3 hours), to short-term research projects where I use GIS to answer a particular question for you (2-10 hours), to longer-term projects where I assemble data about an issue, perform analyses and look for patterns (10+ hours).

Map Design

Do you need a locator map for your business? Maps of demographic data for a non-profit? Professionally-designed maps for a book or journal article? Or maybe you’ve made maps yourself but would like help touching them up before publication?

Whatever the application, I design beautiful maps in grayscale or color. I usually work in Adobe Illustrator and ArcGIS, and can accommodate most typical output formats. Costs estimates for a print design job typically range from $300 – $720 (5 to 12 hours at my standard rate of $60/hour). Please get in touch if you have a map in mind and I can give you more specifics!